A quality of life tool kit in chronic venous disorders
Abstract
Individual preferences are now at the center of the medical decision-making process. Different experimental methods are used to determine preferences. Psychometricians use direct observation of a subject’s reaction in a particular pathological situation: patients are asked to arrange the intensity of the impacts on numerical ordinal scales, but an actual metrical measure is not yet available. Traditionally, economists believe that in a market, only the consumer’s choices enable us to estimate his or her level of satisfaction. In the health care field, where market mechanisms are not fully operational, they tend to extract patient preferences through forced choices between hypothetical health states. A real metrical measure is thus obtained. The objective of this article is to exhibit these 2 methods, psychometric and economic, and show how they have been implemented in medical research.
Introduction
Chronic venous disorders (CVDs) of the lower limbs are highly prevalent disorders and are a true problem of public health, especially in the industrialized countries due to the high costs of investigations, treatments, and complications. The impact of CVDs on the daily life of patients can be assessed by measuring their quality of life (QOL). Most studies conducted to date on patients with CVDs, both at the onset and at its most advanced stage, have shown a significant impact of the disease on QOL. However, disease-specific instruments to evaluate QOL in the context of CVDs were not developed and validated until quite recently. The use of comprehensive QOL instruments has shown greater consistency than the simple reporting of individual symptoms.
Quality-of-Life Approach
The first stage of any study examining QOL is to define the universe of the area to be studied. Once defined, the universe must be categorized to define specific domains to be quantified. In order to assess these domains, a number of criteria or indicators must be available in order to quantify them, and appropriate scaling procedures must be selected. Finally, development of a definitive indicator system must consider the objectives for which it has been designed, without which results are meaningless.1
QOL is such a unifying concept that ultimately all facets of the individual may be included: environmental factors, behavior, and lifestyle. This discussion shall be restricted to those factors that influence patient QOL as a result of disease or its treatment. Life may not, however, be assessed generally: at best, different aspects of life may be assessed. Categorization of health is a difficult stage. The specific nature of the dimensions of health is controversial. Factor analysis has supported the validity of 4 distinct areas: symptoms, functional well-being, emotional stability, and appropriate social integration.2
Until this point, these 4 domains are only concepts, that is, abstract principles. Measurement of these domains must be performed using solid recordable parameters. For each domain, a number of items have to be defined that will act as intermediaries between the abstract characteristics to be inferred and either objective or subjective measures. Choices depend on the approach taken to assess health problems. For some authors, the definition of health may be restricted to the absence of clinical symptoms or biological abnormalities. Others distinguish between those diseases that may be defined by the medical profession and sickness expressed in terms of behavior. A number of definitions stress the patient’s perception of illness, that is, they are based primarily on a patient’s individual satisfaction or lack of satisfaction with his or her well-being. The intensity of symptoms, degree of incapacity, or level of dissatisfaction depend both on the absolute severity of the phenomenon and on the degree to which it interferes with daily life. The scoring procedures, that is the conventions that govern allocation of values for different indicator positions, are a primary feature of standardization required for the measurement instrument.3-5
They package empirical interpretation into a unit which may be used, and dictate the method of statistical assessment of findings. The best characteristic of a scale is its invariance, that is, the degree to which it can be manipulated without distorting its structure. In an ordinal scale, all transformations that preserve the order on the scale do not change available information. Such a scale is said to be preserved following monotonic transformation. In an interval scale, all numbers on the scale may be multiplied by a constant factor, or the origin shifted by a constant number without changing the results. Such a scale is said to be preserved by affine transformation (y=mx+c). Finally, in a ratio scale, the relationship between values is not changed if they are multiplied by the same constant factor. It is preserved by linear transformation (y=mx). The more precise the information contained in the scale, the more restricted the ability becomes to modify the scale without changing the information contained therein. If scales are to be used as measurement instruments, they must be applied appropriately if they are to produce reliable results; in other words, they must measure what they were designed to assess.
A discriminative tool constructed to identify a problem is not necessarily that which allows changes to be followed, and the tool used to follow changes may not be useful to assess whether the allocation of resources is right. The choice of a method requires an initial definition of the users’ needs: identification of a problem,6 assessment of change in response to treatment, or greater and more coherent use of scarce resources. An economist needs overall results and requires a common measurement to compare the effects of decisions high up the health care system: techniques and equipment available to a statistically average population.7 A clinician’s aim is to apply techniques and equipment available and draw the maximum possible benefit for the patient. All features of the disease must be approached, explaining why assessment has remained a multidimensional problem.
These 2 different attitudes have produced 2 different approaches in the development of questionnaires. Quality of life may be globally assessed in 2 ways: (i) by examining the whole heath status to combine, but not categorize, partial observations; or (ii) by composition to construct the general from the specific. The overall approach is based on the supposition that QOL exists as a continuum from good health to death. Most often several dysfunctions appear in combination. Therefore, the entire range of QOL alterations must be situated on an interval scale by reasoning in terms of stereotypes8 or on the basis of a health status classification system.9-22
The assessment involves determining values of coefficients between 0 and 1 attributable to each of these typical states. These weighting factors constitute adjustment factors of the quantity of life according to its quality, hence their name “QOL coefficients.” The product of the number of years or fractions of a year spent in a particular health status and the corresponding QOL coefficient transforms the time spent in poor health into equivalent fractions of years of good health. Repetition of this operation over time for various stages provides the number of years left to live adjusted as a function of the QOL, called QALY (quality-adjusted life years). The cost of the treatment can then be divided by the QALY result in order to compare the respective merits of 2 treatments.23,24
In the compositional approach, a number of items are combined either simply or by ad hoc weighting of selected variables into subscales. These scores by dimensions may or may not be aggregated to produce an overall score. When they remain as distinct entities in the final assessment mechanism they produce profiles. If they are combined into a single figure, the term index or combined indicator is used. In all cases, the method chosen will reflect the complexity of the situation. This is a method which has been used since the 19th century by psychometrists endeavoring to impose “the discipline of measurement and figures to aspects of the spirit.” This concept was also put forward by Alvan Fenstein and the psychopathologists in recommending grading of clinical judgments.25
Utility preference approach
The methods used to record individual preferences are highly varied: “standard gamble,” “time trade-off,” and “category rating.”26-31 The first of these methods was traditionally used to assess key preferences in situations of uncertainty. Therefore, it is considered to be particularly appropriate in medical fields.
The protocol on which it is based is simple: 3 states of health (S1, S2, and S3) are carefully detailed and shown to a subject who must choose between the following options: either treatment A, which guarantees situation S2, or treatment B, which may have 2 possible outcomes—state S1 of probability (P) or state S3 of probability 1-P. States S1, S2, and S3 are arranged in a hierarchy with S2 occupying a position between S1 and S3. When the value of P varies from 0 to 1, this produces a threshold value where the patient is unable to decide between the 2 options. This value may be used to assess the utility of the first of these therapeutic possibilities.
The dilemma faced by patients suffering from varicose vein disease highlights the use of such a system. Mrs X who is suffering from varicose veins may be offered 2 possibilities: either long-term therapy or the risks of vein stripping. The outcome of the first choice in the short term is without doubt: she will live. The second choice is more risky, as the chances of surgical success without anesthesia-related problems have been estimated by her general practitioner to be 99.09% in this case. The patient is caught between 2 possible courses of action: she may either choose the risky situation, which includes an unavoidable risk of death, or adopt the secure option, but, by definition, give up any possibility of improving her functional and esthetic situation. A problem then arises in that, if the patient opts for the secure course, she will be better off than if the worst outcome of the risky approach were to occur, ie, death, but worse off than if the operation succeeds. In order to decide, she must assess the relative desirability of remaining in her present state with varicose veins compared with the best and worst possible outcomes following the higher-risk option. The dilemma may be solved using a standard gamble based on population statistics.
The structure of the gamble is identical to that of the initial problem. Choice is limited to a certain outcome and a risk outcome—survival without sequelae or death. Two differences exist, however, by comparison with the initial dilemma: (i) the decision rests on a hypothetical situation removing emotional overlay which played a part in the initial problem; and (ii) risk calculation is not based on personal assessment, but on an objective measurement. By varying probabilities attributable to the higher- risk situation, it is possible to assess the psychological value that the subject attributes to the certainty situation. Where the chances of success of the risky approach is 99.09%, the patient must choose between the certainty of living with varicose veins or the risk of undergoing an operation that may not succeed due to the risk associated with anesthesia.
The risk may not be worth the gamble and the patient chooses the safe option. If, in contrast, however, the anesthesia risk is very low (P<0.01%), the probability of surviving the operation increases and the patient in this situation will opt for the gamble. Where the chances of success are low, the patient will favor the status quo. In the opposite situation, he or she will tend to lean toward the higher-risk approach. The only difference between these two situations is in the value P, the probability of success.
As this increases, the subject is less likely to choose the safe option and more likely to take the higher-risk option. Finally, there is a threshold coefficient value where the patient is unable to choose between the 2 options. This value may be used to assess the current QOL of the patient. If pain is severe or frequent, the value of the threshold coefficient is low. If the patient will undergo anything to escape his current condition, the operation proposal is accepted even where the chances of success are limited, confirming the patient’s poor state of health. If pain is mild, the critical value for the coefficient is higher, the patient’s present condition approaches that of good health; the patient does not accept the operation proposal unless it is almost certain to succeed.
The utility/preference approach has a number of advantages. First, this method produces a detailed measurement that combines mortality, morbidity, resultant physical sensory effects, socioemotional and cognitive effects, symptoms of the disease, and secondary effects of treatment into one single score. It allows calculation of a weighted life expectancy as a function of QOL, which may not be done with specific profiles used to study the multiple effects of disease over time. Results and costs may be brought together when they may be related to a fundamental domain. Second, the score directly reflects patient preference and is not influenced by weighting factors defined by the healthy population or by the practitioners caring for the patient. The instrument may be specific for the disease if appropriate parameters are chosen to define the areas to be addressed. The method has an undisputed scientific basis: decision in the face of uncertainty, described by Von Neumann and Morgenstern.
Despite the indisputable applications of this mechanism, it cannot be denied that there are restrictions on its use. First, replies vary as a function of the context in which questions are set and, second, it is not always possible to identify clinical variables that form the basis of the overall score. Finally, the sensitivity of a given indicator must be demonstrated in different disease states.
Generic quality of life scales
Generic quality of scales uses a single self-completed questionnaire, which is said to apply to all diseases. The best known are the Sickness Impact Profile (SIP), the Nottingham Health Profile (NHP), and the 36-item Short Form health survey (SF-36). The SIP consists of 136 questions grouped into 2 domains, physical and psychological state, and 5 specific independent categories.32 Taken as a whole, the questionnaire may be used to provide a global score. Each question assesses change in behavior and measures intensity of the upset. An interval scale using apparently equal gradations is used to assess the relative severity of each functional problem.
This system was presented in 1975 to 108 Seattle Health Maintenance Organization members and 25 health professionals. Each point was scored between 0 and 15.
Subdomain and overall global scores were calculated by dividing the sum of individual scores into the maximum possible score. The NHP uses a 2-part questionnaire. The first part consists of 38 questions with “Yes” or “No” responses, covering 6 domains: sleep, physical mobility, pain, effective reactions, social isolation, and emotional reaction. The second part assesses 7 independent variables: work; salary; domestic work; interpersonal relationships; social, family, and sexual life; holidays; and pastimes.33 Results are scored either 0 or 1. Domains are not grouped together, but points assessing each domain are weighted as a function of their relative severity. The reference technique used is pair comparison: each item in a domain is compared successfully with all other points within that domain. The subjectively more severe point is noted in each case. This system was used on a pilot group of l200 laymen without medical training to assess the frequency of points deemed more severe than others. Symptoms and problems were graded in a hierarchy, comparing mean standard deviation with frequency.
The SF-36 questionnaire,34 “SF-36,” is a generic QOL scale widely used throughout the world. It consists of 36 items divided among 8 dimensions: physical functioning (10 items); physical role (4 items); bodily pain (2 items); general health (5 items); vitality (4 items), social functioning (2 items); emotional role (3 items); and mental health (5 items). The higher the score is, the better the patient’s health status.
Profiles are not without merit: their reproducibility and validity have been well established. They also allow assessment of different domains of QOL in one combined scale without using multiple measurement scales. This is easier for both investigators and patients. They do have problems, however; in particular, they do not allow the specific consequences of a given disease on QOL to be assessed. In venous diseases, walking, far from being a handicap, is considered to be therapy, whereas standing upright and remaining immobile, which is not listed in the NHP or the SIP, is a real problem for patients suffering from venous disease. The failure of the parameters used to relate to specific problems inevitably leads to sensitivity failings or even validity problems as the functional defects explored may not be relevant.
The main drawback of the generic scales is their failure to identify small, but significant, clinical changes over time. Disease–specific scales seem to be better suited to discriminate between the benefits of a particular treatment on venous insufficiency. It, therefore, appears important to develop a specific QOL indicator for venous insufficiency that takes into account the patient’s point of view and provides the attending physician with a fine measurement of the functional and psychosocial consequences of the disorder.
Specific quality of life scales
Proponents of a specific QOL scale advocate initial identification of relevant domains based on information reported in the literature and interviews with experts and patients.35-37 Signs and symptoms gathered may be combined to assess the impact of disease on the daily life of the patient. An initial questionnaire is designed to scale the indicators and to select the most relevant items. Given that the item pool is designed to provide the basis for construction of the final questionnaire, it is important to list many more parameters than will be used in the definitive version. For each item, 2 types of questions are formulated. The first concerns the presence and intensity of the impairment experienced, and the second, the importance attributed to it by the patient.
Authors diverge at this stage of the analysis: some only include in the final questionnaire those items with the highest product between frequency and importance.38 The instrument implicitly integrates patient preferences as these constitute the foundations of its structure and are the basis of the choice of the items. However, once the questionnaire has been constructed, the items are equally weighted. The other school eliminates redundant parameters by principal component analysis and regroups items according to their contribution (loading) to different factors.
The example of the CIVIQ-20
The ChronIc Venous Insufficiency QOL Questionnaire (CIVIQ) is the first QOL questionnaire specific to chronic venous disorders (CVDs) based on those rules.39-41 This 20- item questionnaire providing a global index and a profile on 4 QOL dimensions—psychological (9 items), pain (4 items), physical (4 items), and social (3 items)—was initially developed in French (CIVIQ-20). Items on the CIVIQ scale were scored from 1 to 5. A low score for items represented greater patient comfort. Recall period of CIVIQ-20: The recall period was the previous 4 weeks. Calculation of CIVIQ-20 scores: In order to facilitate the interpretation of the results, the scoring system was reversed: the highest figure was allocated to the lowest response option and vice versa such as to obtain a score directly proportional to the QOL. The score for each dimension was obtained by adding scores for each constituent item and the global index was obtained by summing the 20 items. Items were weighted equally. The extreme possible minimum and maximum values that the scales have is dependent on the number of items used in each of the dimensions and on the number of levels or categories for each item.
For example, the score for a scale constructed from 2 items, each of 5 levels, can range from 2 points (2X1) to 10 points (2X5). The score of a scale that includes 5 items of 5 points each range from 5 points (5X1) to 25 points (5X5). It is, therefore, not straightforward to identify different orders of magnitude when calculating mean scores for different dimensions affected. In order to compare mean scores between dimensions or scales, absolute scores were then converted into an index.
The method chosen was the one described by John E. Ware for the SF-36.34 For each dimension, we calculated S, the sum of scores for the patients’ answers to the questions; m, the minimum theoretical value if all of the answers were on the first level of the scale for all of the items belonging to the dimension; and M, the maximum theoretical value if all of the items were scored at the maximum level on the scale for all items belonging to the dimension.
The standardized score for each dimension was obtained by applying the following equation: (S-m)/(M-m)_100. For each dimension, we obtained a result from 0 to 100. According to this scoring method, improvement in QOL between day 0 and day 28 is represented by an increase in the score. The difference is therefore positive in such situation.
Cross-cultural equivalence of CIVIQ-20
CIVIQ-20 was translated into English before subsequent use in a prospective, multicenter, international study, the Reflux assEssment and quality of lIfe improvEment with micronized Flavonoids study (RELIEF), which assessed QOL in 4048 adult patients from 18 countries with CVDs (46.6% of whom had venous reflux). This process requires the identification of cross-cultural equivalence of the concepts or constructs measured so that comparisons may be made between populations of different cultures. Thus, the content of the questionnaire was first submitted for consideration by the different countries involved. The linguistic validation was performed in 2 steps: first, confirmation of the cultural relevance of the questionnaire’s content; and second, the translation process.
Cultural adaptations into English, Italian, Polish, Portuguese, and Spanish were undertaken. Additional versions were then made available in Arabic, Czech, Hungarian, Russian, and Slovak. During this process, some conceptual changes were made to refine the content validity of the social dimension of the CIVIQ. Item no. 11 “practicing sport” was translated in order to reflect a physical concept more than a social concept. This explains why it tends to fall under the physical dimension in the international sample. The same choice was made for item no. 10 “going out in the evening” with similar results. Items no. 8 “traveling (car, bus, plane),” no. 9 “doing the housework,” and no. 15 “having to take precautions” faced specific translation problems which result here in a questionable cross-cultural conceptual equivalence. In all, 9 versions were used in the RELIEF study. With time, seventeen (17) linguistic versions were validated using a forward-backward methodology and 11 versions were the result of simple translation of the source questionnaire.42 (Table 1)
Metrical properties to be validated in any quality of life questionnaire
Quality of life scales must be validated before being used in clinical trials. The scales must have specific metrological properties that must be confirmed in a validation study; these properties are face validity, content validity, precision, accuracy, and sensitivity.43-48 A systematic review of the literature about quality of life scales in CVDs was conducted. It confirmed a paucity of validation studies, except for two scales: CIVIQ and VEINES.QOL.49
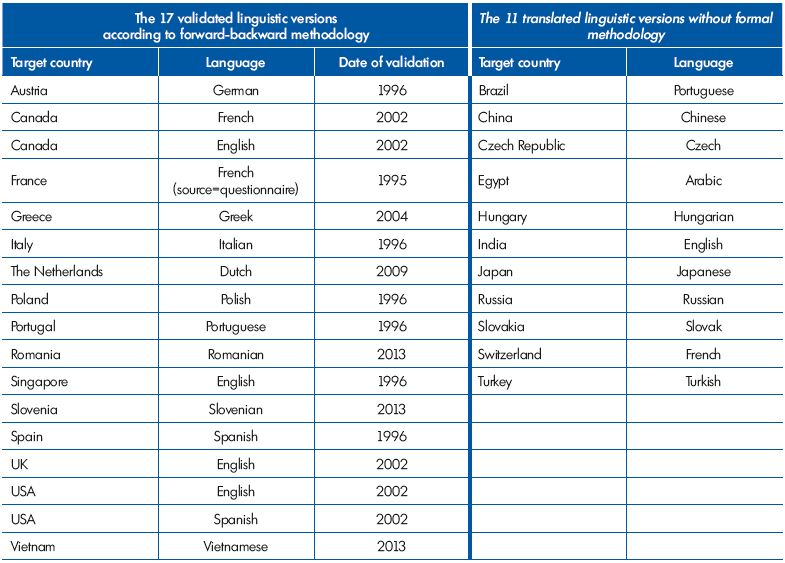
Table I. Summary of the available linguistic versions of CIVIQ-20
Face validity
The face validity of a questionnaire depends on the quality of its preparation: are the questions precise enough to specify the domains explored? Do they relate to a well-defined period of time? Is the aggregation procedure adequate? It is better to phrase sentences based directly on patients’ descriptions. When the patients’ own vocabulary is used to compile the questionnaire, a simple construction is obtained, without which it would be impossible for the patients to participate actively in the survey.
Content validity
Content validity requires 2 conditions to be fulfilled: the entire range of patients’ complaints must be included, and the items chosen must be shown to be representative. The content validity of the CIVIQ-20 is supported by the fact that the process used to select items was based on input from direct definitions of complaints obtained from patients suffering from venous insufficiency. The use of factorial analysis enabled redundant items to be identified and excluded.
Reliability
A scale is reliable if, when measuring the same phenomenon on a number of occasions, it produces similar results. To determine reliability, the size of random measurement error must be assessed. If this is low, the instrument provides a consistent measurement of the universe assessed. A number of authors describe this criterion as fidelity; others refer to the precision of the instrument. The most common method that is used to address this problem is internal consistency reliability and stability (test-retest) reliability.50 Different items in a dimension must be homogenous as they relate to the same concept even if they are worded differently. This “internal consistency” is tested by the Cronbach , values of which range from 0 to 1. Coefficients above 0.70 are generally regarded as acceptable for psychometric measurements. Intraclass correlation coefficients are used to confirm that the indicator is reproducible, ie, to ensure that the answers to the same questionnaire remain unchanged in stable patients.
Construct validity
An instrument is said to be valid if it measures what it truly purports to measure. This assumes both the absence of random error and systematic bias. Reliability is, therefore, a prerequisite, but is not sufficient for validity. For perfect validity, there must be no consistent error. In the absence of an undisputed reference standard, the validity of a measurement scale is obtained by: (i) confirming that its factorial structure remains stable on different population samples (structural validity); (ii) testing if the results obtained using the scale fit the expected relationship across a group of individuals or clinical data available (known group differences); and (iii) comparing its results at a given point of time, and longitudinally either with other validated QOL scales assessing the same domain or with clinical indicators (convergent validity). Convergent validity is fulfilled when the scales score for a related concept produces a Spearman correlation coefficient >0.4.
Responsiveness
The sensitivity of an instrument is its capacity to detect clinically significant changes even if they are of low amplitude. Changes in scores must be able to be demonstrated in patients whose state of health is deteriorating (or improving). An inadequately sensitive indicator might miss differences between 2 treatments, as it may be unable to detect subtle changes in the patients’ corresponding clinical states. An indicator is sensitive when it detects all changes in a given variable over and above the imprecision due to measurement error. Different statistical methods have been described to assess sensitivity in detecting change. The least contentious appears to be the standardized response mean (SRM) and the effect size (ES) as described by Liang51 and Guyatt.52 SRM is the ratio of the mean change to the standard deviation of the change. The ES is identical to the SRM, but uses the standard deviation of the scores on day 0 as the denominator.
Conclusion
QOL is, for the physician, a means to rise above too biological of an approach. Beyond organic disease, body spirit must be examined. The physician tries to achieve the best possible management for his patient who entrusts him with his most precious possession: his life. The objective is to control every aspect of the disease, which explains the physician’s desire to remain within an objective and multidimensional framework. The scientific collection of data leaves little place for the evaluation of an individual’s preferences. For the patient, it is important to express the specificity of his complaints. The evaluation instrument has to reflect the patient’s central values and should integrate patient preferences in its structure and for the choice of its components.
For society, the goal of measurement is not to assess “the importance which each of us attaches to our lives,” but to produce an overall morbidity indicator through which the effects of actions influencing health may be judged. The tool to be used requires a precise initial definition of users’ needs. The choice of an indicator depends on the answers to the following questions: does the user require an indicator producing discriminative or evaluative results? Does he wish to assess the overall QOL or specific facets of it? Which opinion is to be used: that of the doctor, that of the patient, or that of the population? Only too often, the available instruments are used blindly without clearly addressing these questions.


REFERENCES
1. Launois R. Qualité de vie: Panorama et mise en perspective. In: Décision Thérapeutique et Qualité de vie. Launois R, Régnier F, eds. Association Française pour la Recherche Thérapeutique. Paris, France: John Libbey Eurotext; 1992.
2. Cella DF. Quality of life: the concept. J Palliat Care. 1992;8:8-13.
3. Stevens S. On the theory of scales and measurement. Science. 1946;103:667- 680.
4. Haski M, Moskowitz H. L’échelle sensorielle de Stevens-Moskowitz. Rev Fr Marketing. 1980;21:518.
5. Boss JF. Quelques aspects de la mesure des attitudes: les échelles multidimensionnelles. Rev Fr Marketing. 1970;34:23-44.
6. Kischner B, Guyatt G. A methodological framework for assessing health indices. J Chron Dis. 1985;38:27-36.
7. Dupuy JP. La science de décision en matière de santé : quelques éléments de réflexion. Economie et Santé. 1971;3:2- 29.
8. Llewellyn-Thomas H, Sutherland HJ, Tibshirani R, Ciampi A, Till JE, Boyd NF. Describing health states: methodological issues in obtaining values for health states. Med Care. 1984;22:543-552.
9. Cadman D, Goldsmith C, Torrance GW, et al. Development of a health status index for Ontario children. Final report to Ontario Ministry of Health, 1986. Research Grant DM648.
10. Kaplan R, Anderson J. A general health policy model: update and applications. Health Serv Res. 1988;23:203-235.
11. Sintonen H, Pekurinen M. 15-D: a 15 dimension measure of health. Presented at the Health Economists Study Group Meeting, Brunel University, London, UK; 1988;18-22.
12. Boyle M, Furlong W, Torrance G, et al. Reliability of health utilities index-Mark III used in the 1991 cycle 6 General Social Survey Health Questionnaire. Cheap Working Paper Series. 1994;94-97.
13. Kind P, Rosser R, Williams A. Valuation of quality of life: some psychometric evidence. In: Jones-Lee MW, ed. The value of life and safety. Amsterdam, Netherlands: Elsevier; 1982.
14. The EuroQol Group. Euroqol—a new facility for the measurement of healthrelated quality of life. Health Policy. 1990;16:199-208.
15. Dolan P. Modelling valuations for EuroQol health states. Med Care. 1997;35:1095-1108.
16. Dolan P, Gudex C, Kind P, et al. A social tariff for Euro-Qol: results from a UK general population survey. University of York, York, UK; Center for Health Economics. 1995;Discussion paper 138.
17. Torrance GW, Feeny D, Goldsmith C, et al. A multilinear multi-attribute utility function for the health utilities index mark 3 (HUI13). Med Decis Making. 1998;18:490.
18. Anderson JP, Bush JW. Policy space areas and properties of benefit-cost/utility analysis. JAMA. 1986;255:794-795.
19. Weinstein MC, Stason WB. Foundations of cost-effectiveness analysis for health and medical practices. N Engl J Med. 1977;96:716-721.
20. Williams A. Economics of coronary artery bypass grafting. BMJ. 1985;291:326- 329.
21. Torrance G, Feeny D. Utilities and quality adjusted life years. Int J Technol Assess Health Care. 1989;5:559-575.
22. Gadreau M. Une mesure de la santé. Collection de l’Institut de Mathématiques Economiques No. 17, Sirey Paris, 1978.
23. Laupacis A, Feeny D, Detsky AS, Tugwell PX. How attractive does a new technology have to be to warrant adoption and utilization? Tentative guidelines for using clinical and economic evaluations. CMAJ. 1992;146:473-481.
24. Tengs TO, Adams ME, Pliskin JS, et al. Five-hundred life-saving interventions and their cost-effectiveness. Risk Anal.1995;15:369-390.
25. Guelfi JD, Boben D. Échelle d’évaluation en psychiatrie. Encyl Med Chir Psychiatrie. 37200 A10; 1989:1-10.
26. Torrance GW. Preferences for health states. A review of measurement methods. In: Clinical and Economic Evaluation of Perinatal and Developmental Medicine N. 20 Evancill. Evansville, Ind: Mead Johnson and Co; 1982.
27. Patrick DL, Bush JW, Chen M. Method for measuring levels of well-being for a health-status index. Health Serv Res. 1973:229-245.
28. McNeil B. Weichselbaum R, Pauker SG. Speech and survival. Trade-offs between quality and quantity of life in laryngeal cancer. N Engl J Med. 1981;305:982- 987.
29. McNeil BJ, Pauker SG. Incorporation of patient values in medical decision making. In: McNeil B, Cravalho E, eds. Critical issues in medical technology. Boston, Mass: Auburn House;1982:113-126.
30. Boyle MH, Torrance GW, Sinclair JC, Horwood SP. Economic evaluation of neonatal intensive care of very-lowbirth- weight infants. N Engl J Med. 1983;308:1330-1337.
31. Torrance G, Zipurky A. Cost effectiveness of antepartum prevention of RH immunization. Clinics Perinatol. 1984;11:267-281.
32. Bergner M, Bobbitt RA, Kressel S, Pollard WE, Gilson BS, Morris JR. The Sickness Impack Profile: conceptual formalization and methodology for the development of a health status measure. Int J Health Serv. 1976;6:393-415.
33. Buquet D. Indicateur de santé perceptuelle de Nottingham. Manuel d’utilisation. Inserm. Unité 164, Villejuif, France; May 1988.
34. Ware JE Jr. The SF-36 Health Survey. In: Spilker B, ed. Quality of life and pharmacoeconomics in clinical trials. 2nd ed. Philadelphia, Pa: Lippincott-Raven; 1996:337-345.
35. Guyatt G, Bombardier C, Tugwell PX. Measuring disease specific quality of life in clinical trials. Can Med Assoc J. 1986;134:889-995.
36. Guyatt GH. Measuring quality of life: a review of means of measurement in clinical trials of new medicines. Pharmaceut Med. 1987;2:49-60.
37. Guyatt GH, Veldhuyzen Van Zanten SJ, Feeny DH, Patrick DL. Measuring quality of life in clinical trials: a taxonomy and review. CMAJ. 1989;140:1441-1448.
38. Guyatt G. The questionnaire in the assessment of cardiorespiratory disease: the McMaster approach. Workshop on the assessment of the effect of drug therapy on the quality of life in cardiorespiratory disease. April 25-26, 1985; Broadway, Worcestershire, UK.
39. Launois R. At the crossroads of venous insufficiency and hemorrhoidal disease: MPFF at a dose of 500 mg—Repercussions of venous insufficiency on everyday life. Angiology. 1994;45:495-504.
40. Launois R, Reboul-Marty J, Henry B. Construction and validation of a quality of life questionnaire in chronic lower limb venous insufficiency (CIVIQ). Qual Life Res. 1996;5:539-554.
41. Launois R, Mansilha A, Jantet G. International psychometric validation of the chronic venous disease quality of life questionnaire (CIVIQ-20). Eur J Vasc Endovasc Surg. 2010;40:783-789.
42. Launois R, Mansilha A, Lozano F. Linguistic validation of the 20 itemchronic venous disease quality of life questionnaire (CIVIQ-20). Phlebology. 20 13;doi:10.1177/0268355513479582.
43. Churchill G. A paradigm for developing better measures of marketing constructs. J Marketing Res. 1979;16:64-73.
44. Ware JE Jr. Standards for validating health measures: definition and content. J Chronic Dis. 1987;40:473-480.
45. Kaplan R. Bush JW, Berry C. Health status: type of validity and the index of well-being. Health Serv Res. 1976;11:478-506.
46. I srael L, Waintraub L. Méthodes d’évaluation psychométriques en gériatrie. Le choix d’un instrument et ses critères de fiabilité. Presse Med. 1983;12:3124-3128.
47. Moret J, Chwalow C, Baudoin-Balleur. Evaluer la qualité de vie: construction d’une échelle. Rev Epidem Sante Publique. 1993;41:65-71.
48. Nunnaly JC. Psychometric Theory. 2nd edition. New York, NY: McGraw Hill Book Company; 1978.
49. Launois R. Health-related quality of life scales specific for chronic venous disorders of the lower limbs. J Vasc Surg Venous & Lymph Dis. 2015. In press.
50. Deyo RA, Diehr P, Patrick DL. Reproducibility and responsiveness of Health Status Measures—statistics and strategies for evaluation. Control Clin Trials. 1991;12:142S-158S.
51. Liang MH, Fossel AH, Larson MG. Comparisons of five health status instruments for orthopedic evaluation. Med Care. 1990;28:632-642.
52. Guyatt G, Walter S, Norman G. Measuring change over time. Assessing the usefulness of evaluative instruments. J Chronic Dis. 1987;40:171-178.